Grouping microstates into states
The word state is overloaded and is easilyt one of the more slippery defined concepts in physics/chemistry and biology. SO let us try to be more precise:
A microstate : a single frozen snapshot of atomic configurations (in CM). For instance instanenotus positions and momenta of all atoms in Ar gas.
A state, : a collection (fairly large) of microstates. For instance open vs colsed states of a polymer.
Relative populations of states
Probabilities are what we observe experimentally. To develop intuition about how energies, entropies, and free energies influence the probabilities of states, let us take a generic 1D model of the energy of a system that has a parabolic shape around some stable states A and B. We will use results obtained in NVT ensemble lecture to derive ratio of probabilities fo macrostates
import numpy as np
import scipy
import matplotlib.pyplot as plt
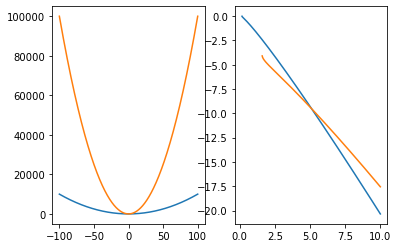
def E(x, k, x0=0, U0=1):
return U0 + k*(x-x0)**2
def FE(k, kbT=1, U0=1):
return U0 - kbT * np.log(2*np.pi*kbT/k)**0.5
x = np.linspace(-100, 100, 1000)
Ea = E(x, k=1, x0= 0, U0=0.)
Eb = E(x, k=10, x0= 0, U0=-4.)
kbT = np.linspace(0.1, 10, 1000)
Fa = FE(k=1, U0=0, kbT=kbT)
Fb = FE(k=10, U0=-4, kbT=kbT)
#fig, ax = plt.subplots(ncols=2)
# Plot energies
# Plot free energies/var/folders/9f/f06qc63d24q6pfxc72fx9m2w0000gp/T/ipykernel_49262/1938679140.py:5: RuntimeWarning: invalid value encountered in sqrt
return U0 - kbT * np.log(2*np.pi*kbT/k)**0.5
Protein folding problem with 1D potential
As crazy as it sounds we can learn something about protein folding by using a simple 1D potential:

def U_fold1D(ratio=1/25, deltaU=50, T=0.1):

    '''1D energy function, where
    rationL: fraction of folded vs unfolded states (must be less than 1)
    deltaU: energy difference between unfolded and folded states (must be positive) in units of kb = 1
    T: temperature (must be possitive)
    OUTPUT: x coordinate, U(x) potential, pf, pu" fractions of folded and funfolded states respectively.
    '''
    assert np.any(T) > 0
    assert ratio < 1
    assert deltaU > 0

    x = np.linspace(0,1,1000)
    U = np.linspace(0,1,1000)

    U[x < ratio] = 0
    U[x > ratio] = deltaU

    pf = ratio/(ratio+np.exp(-deltaU/T))
    pu = 1 - pf

    U[0] = U[-1] = 100 # set end states to be high

    return x, U, pf, pu
x, u, pf, pu = U_fold1D()
fig, ax = plt.subplots(nrows=2)
ax[0].plot(x,u, lw =3)
ax[0].set_xlabel('$x$')
ax[0].set_ylabel('$U(x)$')
ax[1].plot(x,np.exp(-u), lw=3, color='orange')
ax[1].set_xlabel('$x$')
ax[1].set_ylabel('$p(x)$')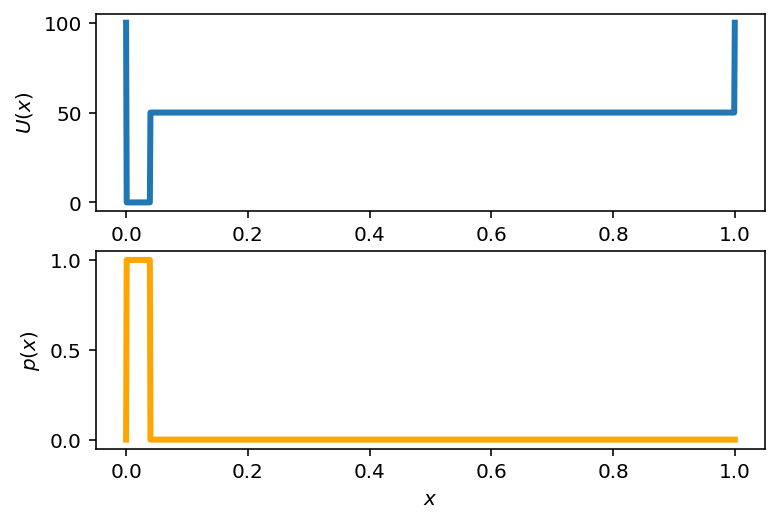
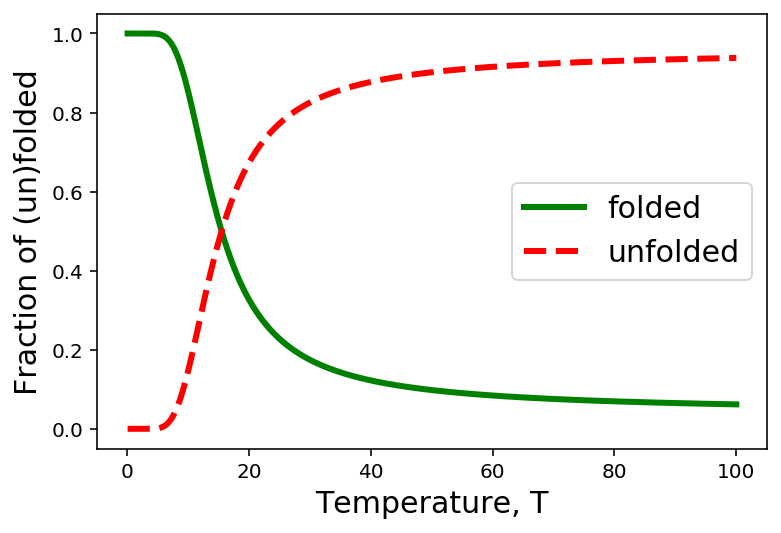
T = np.linspace(0.1,100,1000)
x, u, pf, pu = U_fold1D(T=T)

plt.plot(T,pf,lw=3, color='green')
plt.plot(T,pu,'--',lw=3, color='red')

plt.xlabel('Temperature, T',fontsize=15)

plt.ylabel('Fraction of (un)folded',fontsize=15)

plt.legend(['folded','unfolded'],fontsize=15)