Vibrational Spectroscopy with Harmonic Oscillator
Note that symbols (quantum number) and (vibrational frequency) look very similar but have different meanings!
A typical value for vibrational frequency would be around . Small values are associated with weak bonds, whereas strong bonds have larger vibrational frequencies.
Beyond the Harmonic Approximation
The harmonic potential is an approximation that does not allow for molecular dissociation, making it an unrealistic model when far from equilibrium geometry. The harmonic potential is expressed as:
Here, is the force constant, is the equilibrium bond length, and is the distance between the two atoms.
The true potential energy curve, however, can be derived from theoretical calculations or, to some extent, from spectroscopic experiments. Unlike the harmonic potential, this curve has a complex shape, making it challenging to solve the nuclear Schrödinger equation exactly.
The harmonic approximation can be understood as a Taylor series expansion around :
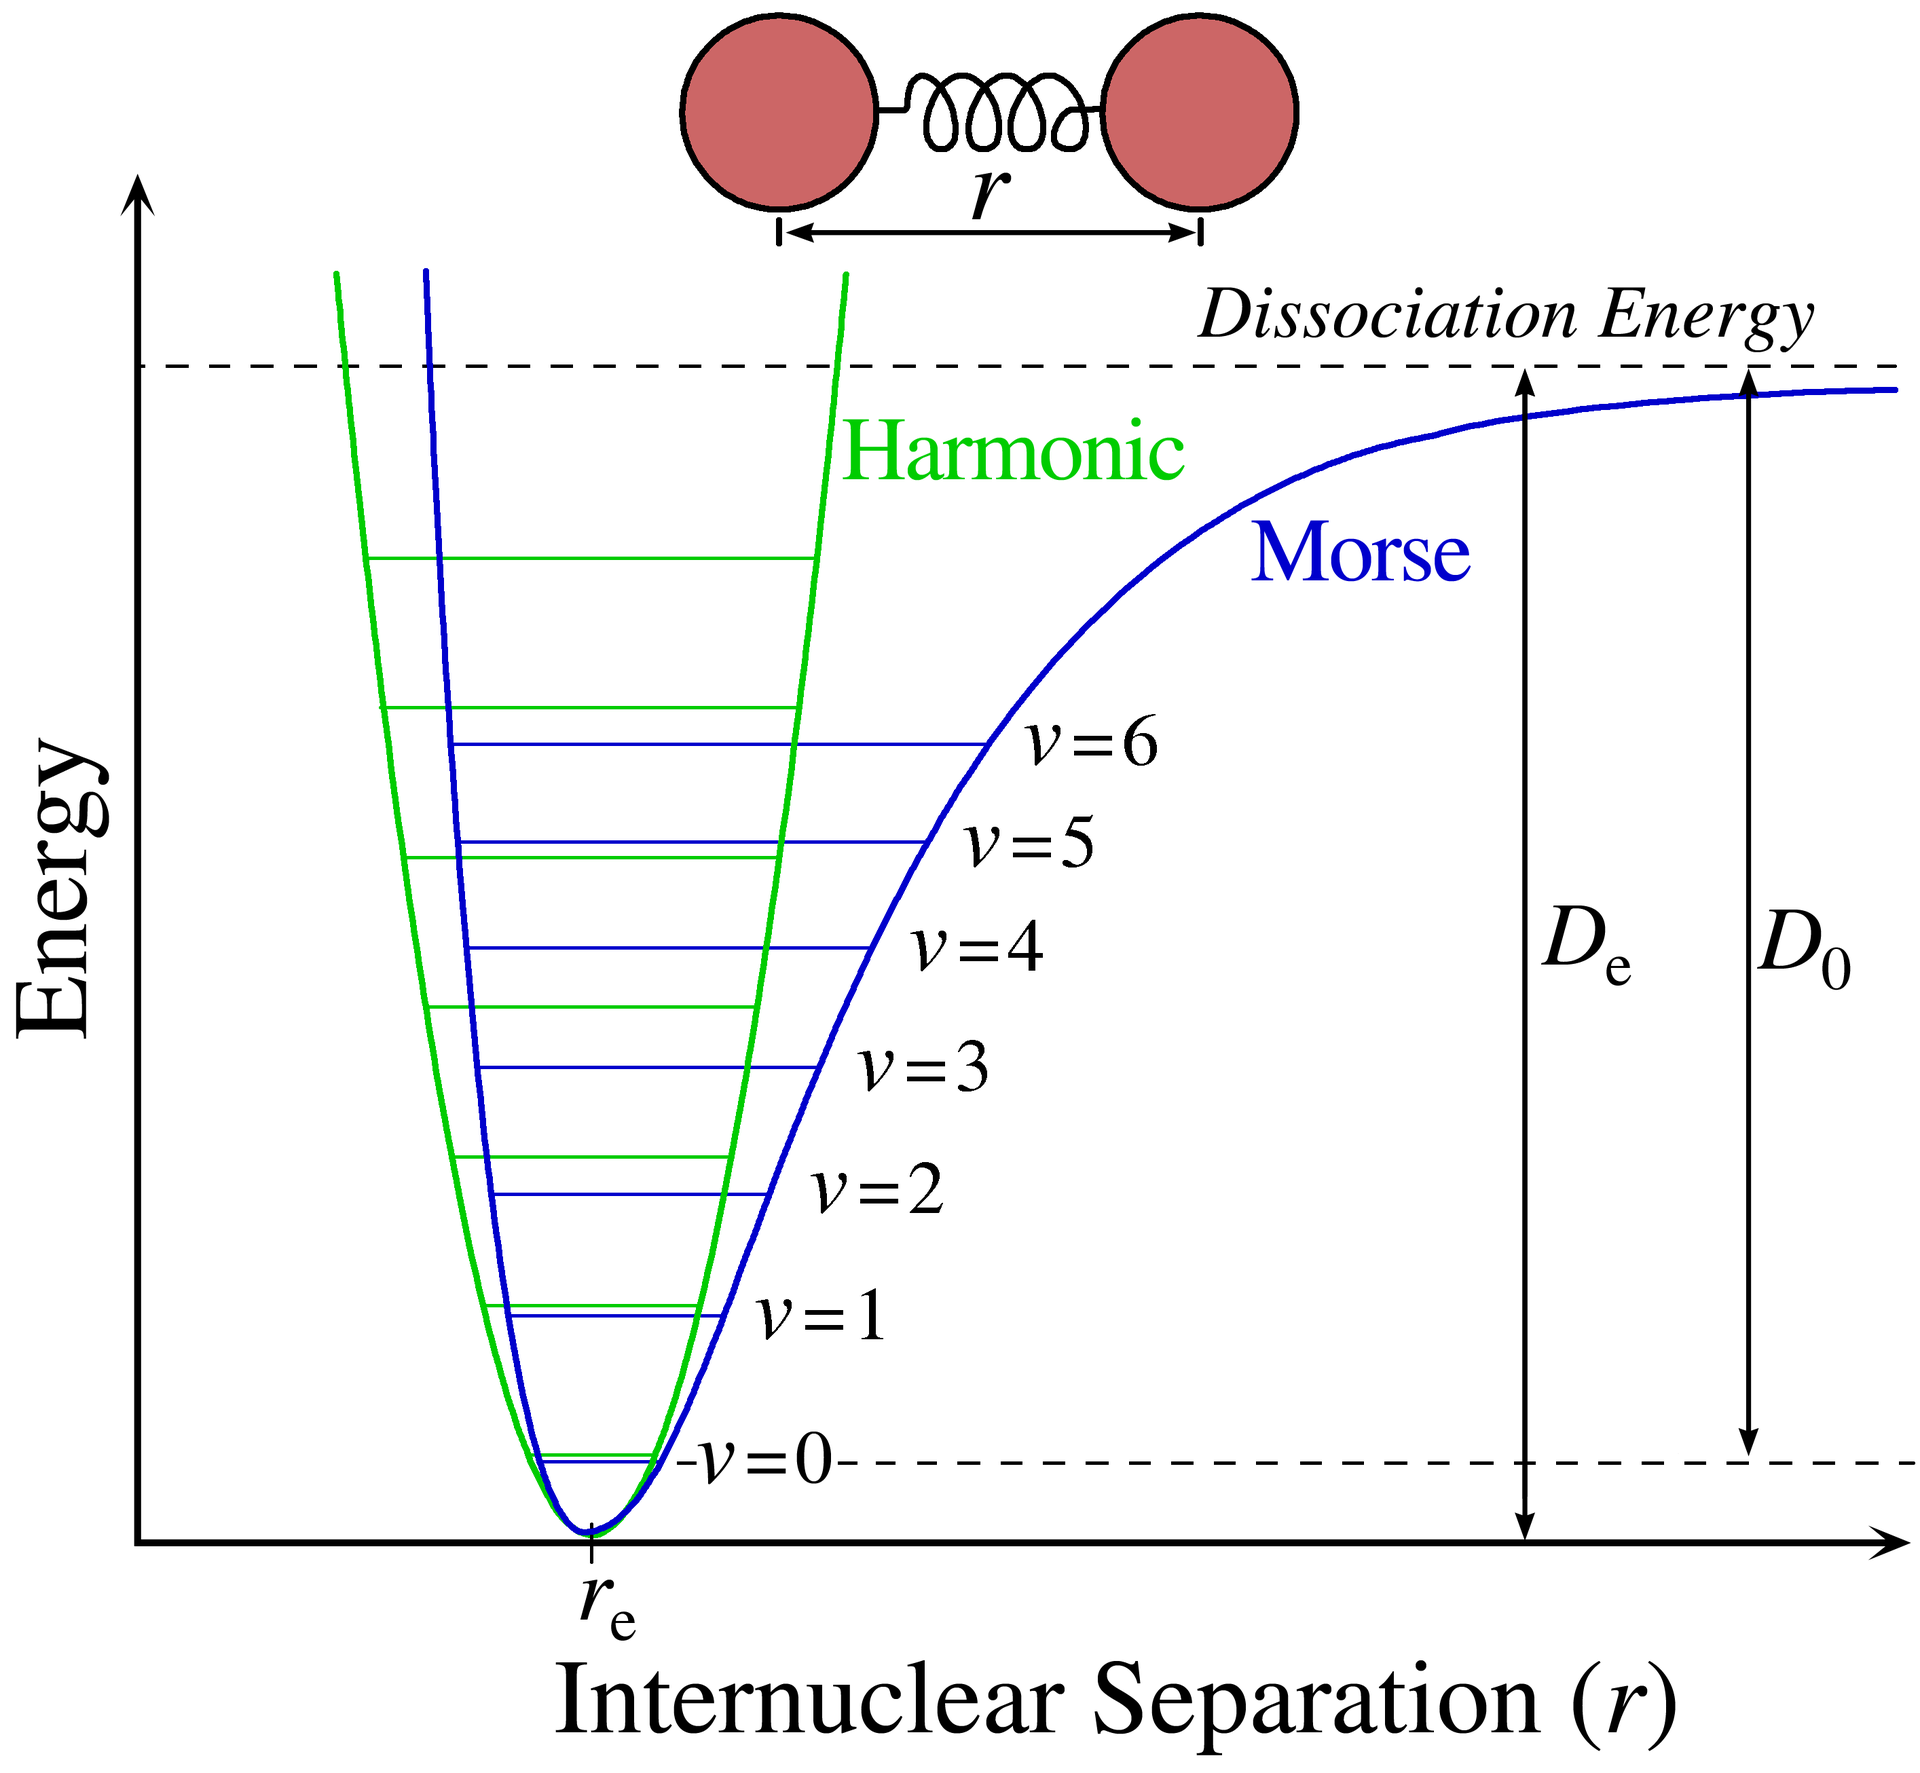
Figure 1:Harmonic and Morse potentials compared, distinguishing the equilibrium dissociation energy from the spectroscopic dissociation energy .
Morse potential and dissociation energy
The Morse potential provides a more accurate description of molecular vibrations and predicts dissociation as well as changing spacing between energy levels.
is measured from the bottom of the potential to the dissociation limit whereas is measured from the lowest vibrational level to the dissociation limit.
Source
import numpy as np
from scipy.constants import h, hbar, c, u
from scipy.special import genlaguerre, gamma, factorial
from matplotlib import pyplot as plt

# Factor for conversion from cm-1 to J
FAC = 100 * h * c

class Morse:
    """A class representing the Morse oscillator model of a diatomic."""

    def __init__(self, mA, mB, we, wexe, re, Te):
        """Initialize the Morse model for a diatomic molecule.

        mA, mB are the atom masses (atomic mass units).
        we, wexe are the Morse parameters (cm-1).
        re is the equilibrium bond length (m).
        Te is the electronic energy (minimum of the potential well; origin
            of the vibrational state energies).

        """

        self.mA, self.mB = mA, mB
        self.mu = mA*mB/(mA+mB) * u
        self.we, self.wexe = we, wexe
        self.re = re
        self.Te = Te

        self.De = we**2 / 4 / wexe * FAC
        self.ke = (2 * np.pi * c * 100 * we)**2 * self.mu
        #  Morse parameters, a and lambda.
        self.a = self.calc_a()
        self.lam = np.sqrt(2 * self.mu * self.De) / self.a / hbar
        # Maximum vibrational quantum number.
        self.vmax = int(np.floor(self.lam - 0.5))

        self.make_rgrid()
        self.V = self.Vmorse(self.r)

    def make_rgrid(self, n=1000, rmin=None, rmax=None, retstep=False):
        """Make a suitable grid of internuclear separations."""

        self.rmin, self.rmax = rmin, rmax
        if rmin is None:
            # minimum r where V(r)=De on repulsive edge
            self.rmin = self.re - np.log(2) / self.a
        if rmax is None:
            # maximum r where V(r)=f.De
            f = 0.999
            self.rmax = self.re - np.log(1-f)/self.a
        self.r, self.dr = np.linspace(self.rmin, self.rmax, n,
                                      retstep=True)
        if retstep:
            return self.r, self.dr
        return self.r

    def calc_a(self):
        """Calculate the Morse parameter, a.

        Returns the Morse parameter, a, from the equilibrium
        vibrational wavenumber, we in cm-1, and the dissociation
        energy, De in J.

        """

        return (self.we * np.sqrt(2 * self.mu/self.De) * np.pi *
                c * 100)

    def Vmorse(self, r):
        """Calculate the Morse potential, V(r).

        Returns the Morse potential at r (in m) for parameters De
        (in J), a (in m-1) and re (in m).

        """

        return self.De * (1 - np.exp(-self.a*(r - self.re)))**2

    def Emorse(self, v):
        """Calculate the energy of a Morse oscillator in state v.

        Returns the energy of a Morse oscillator parameterized by
        equilibrium vibrational frequency we and anharmonicity
        constant, wexe (both in cm-1).

        """
        vphalf = v + 0.5
        return (self.we * vphalf - self.wexe * vphalf**2) * FAC

    def calc_turning_pts(self, E):
        """Calculate the classical turning points at energy E.

        Returns rm and rp, the classical turning points of the Morse
        oscillator at energy E (provided in J). rm < rp.

        """

        b = np.sqrt(E / self.De)
        return (self.re - np.log(1+b) / self.a,
                self.re - np.log(1-b) / self.a)

    def calc_psi(self, v, r=None, normed=True, psi_max=1):
        """Calculates the Morse oscillator wavefunction, psi_v.

        Returns the Morse oscillator wavefunction at vibrational
        quantum number v. The returned function is "normalized" to
        give peak value psi_max.

        """

        if r is None:
            r = self.r
        z = 2 * self.lam * np.exp(-self.a*(r - self.re))
        alpha = 2*(self.lam - v) - 1
        psi = (z**(self.lam-v-0.5) * np.exp(-z/2) *
               genlaguerre(v, alpha)(z))
        psi *= psi_max / np.max(psi)
        return psi

    def calc_psi_z(self, v, z):
        alpha = 2*(self.lam - v) - 1
        psi = (z**(self.lam-v-0.5) * np.exp(-z/2) *
               genlaguerre(v, alpha)(z))
        Nv = np.sqrt(factorial(v) * (2*self.lam - 2*v - 1) /
                     gamma(2*self.lam - v))
        return Nv * psi

    def plot_V(self, ax, **kwargs):
        """Plot the Morse potential on Axes ax."""

        ax.plot(self.r*1.e10, self.V / FAC + self.Te, **kwargs)

    def get_vmax(self):
        """Return the maximum vibrational quantum number."""

        return int(self.we / 2 / self.wexe - 0.5)

    def draw_Elines(self, vlist, ax, **kwargs):
        """Draw lines on Axes ax representing the energy level(s) in vlist."""

        if isinstance(vlist, int):
            vlist = [vlist]
        for v in vlist:
            E = self.Emorse(v)
            rm, rp = self.calc_turning_pts(E)
            ax.hlines(E / FAC + self.Te, rm*1.e10, rp*1e10, **kwargs)

    def label_levels(self, vlist, ax):
        if isinstance(vlist, int):
            vlist = [vlist]

        for v in vlist:
            E = self.Emorse(v)
            rm, rp = self.calc_turning_pts(E)
            ax.text(s=r'$v={}$'.format(v), x=rp*1e10 + 0.6,
                    y=E / FAC + self.Te, va='center')

    def plot_psi(self, vlist, ax, r_plot=None, scaling=1, **kwargs):
        """Plot the Morse wavefunction(s) in vlist on Axes ax."""
        if isinstance(vlist, int):
            vlist = [vlist]
        for v in vlist:
            E = self.Emorse(v)
            if r_plot is None:
                rm, rp = self.calc_turning_pts(E)
                x = self.r[self.r<rp*1.2]
            else:
                x = r_plot
            psi = self.calc_psi(v, r=x, psi_max=self.we/2)
            psi_plot = psi*scaling + self.Emorse(v)/FAC + self.Te
            ax.plot(x*1.e10, psi_plot, **kwargs)


### Plot for (1H)(35Cl)
mA, mB = 1., 35.
X_re = 1.27455e-10
X_Te = 0
X_we, X_wexe = 2990.945, 52.818595

X = Morse(mA, mB, X_we, X_wexe, X_re, X_Te)
X.make_rgrid()
X.V = X.Vmorse(X.r)

fig, ax = plt.subplots(figsize=(11, 11))
X.plot_V(ax, color='k')

X.draw_Elines(range(X.vmax), ax)
X.draw_Elines(X.get_vmax(), ax, linestyles='--', linewidths=1)
X.plot_psi([0, 5, 10, 20], ax, scaling=2, color='maroon')
X.label_levels([0, 5, 10, 20], ax)

ax.set_xlabel(r'$r[\AA]$')
ax.spines['top'].set_visible(False)
ax.spines['right'].set_visible(False)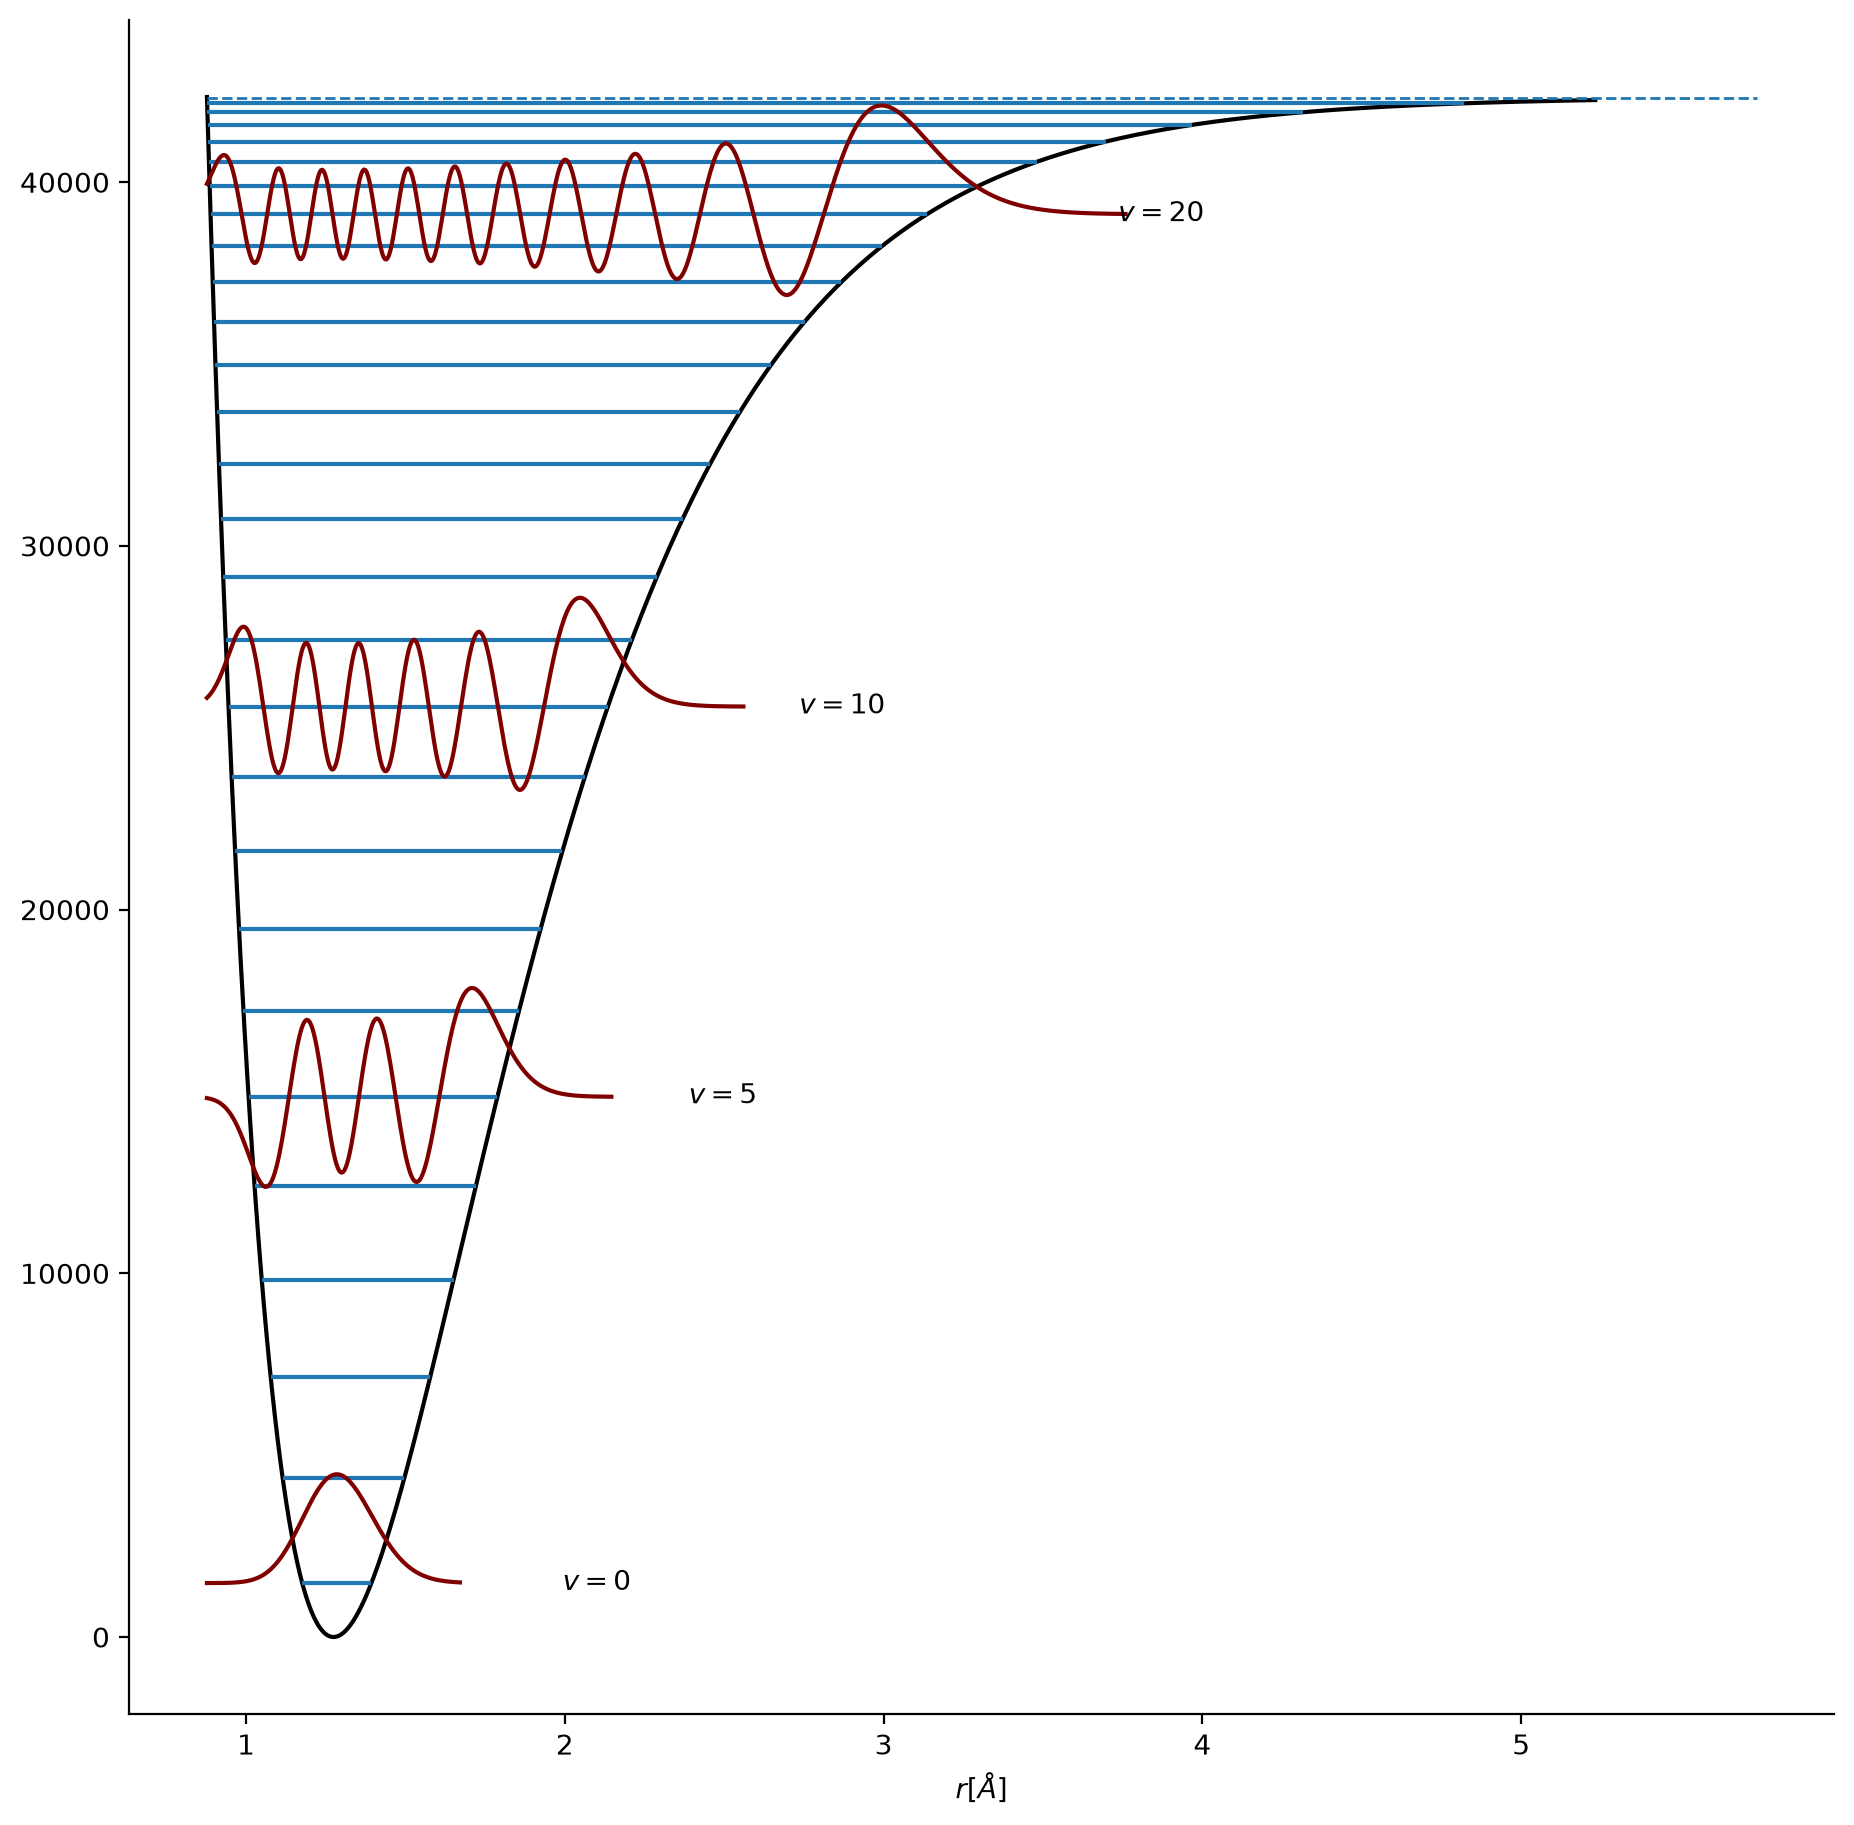
Anharmonic oscillator
We can account for the deviation from harmonic behavior by adding higher-order polynomial terms to . The addition of new terms allows for eventual dissociation to happen when a molecule is excited to high vibrational energy states.
Overtone transitions
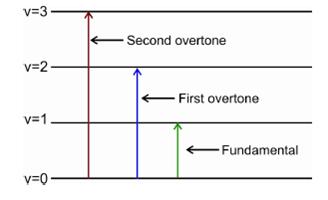
Figure 2:Illustration of overtone transitions
The higher order terms are small but they give rise to overtone transitions with with rapidly decreasing intensities.
Solution
We make use of the equation to compute transitions to levels 1 (fundamental), 2 (first overtone) and 3 (second overtone)
Population of vibrational states
Out of all possible vibrational states which states do molecules occupy at room temperature? For harmonic oscillator, the Boltzmann distribution gives the statistical weight for the level:
Note that the degeneracy factor is identically one because there is no degeneracy in one dimensional harmonic oscillator. To proceed, we recall geometric series:
For example, for the thermal population of the first vibrational level is very small about 10-7.
This is why generally the excited vibrational levels do not contribute to the (IR) spectrum.
Vibrational modes of molecules
A molecule has translational and rotational motion as a whole, while each atom has its own motion. The vibrational modes can be IR or Raman active. For a mode to be observed in the IR spectrum, a change must occur in the permanent dipole (i.e. not homonuclear diatomic molecules). Homonuclear diatomic molecules are observed in the Raman spectrum but not in the IR spectrum. This is because such molecules have one band and no permanent dipole, and therefore a single vibration. Examples would be or .
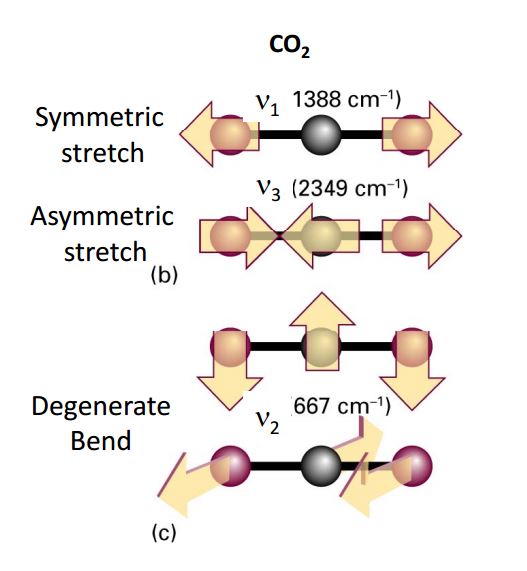
Figure 3:Normal modes of with associated vibrational frequencies
However, heteronuclear diatomic molecules (e.g. CN) do absorb in the IR spectrum. Polyatomic molecules undergo more complex vibrations that can be summed or resolved into normal modes of vibration. For polyatomic molecules, the normal modes of vibration are: asymmetric, symmetric, wagging, twisting, scissoring, and rocking.
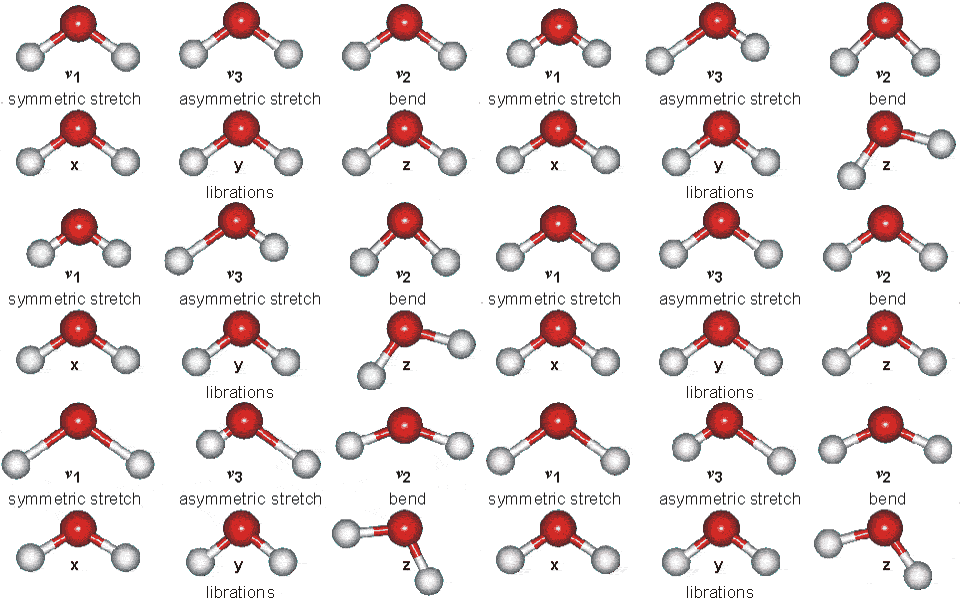
Figure 4:Vibrational modes of water
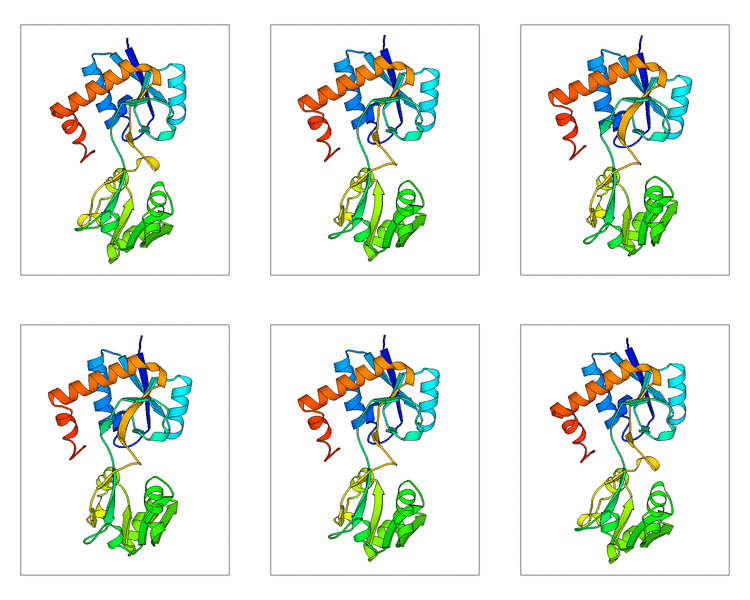
Figure 5:Slowest vibrational mode in a protein, linked to its catalytic function.
Selection rules and Transition Dipole Moment
Selection rules in spectroscopy are fundamental principles that dictate whether a transition is allowed or forbidden during the absorption or emission of electromagnetic radiation, such as in infrared (IR) or Raman spectroscopy. The origins of these rules lie in the fact that a photon can induce coupling between the initial and final quantum states only under specific conditions.
In spectroscopy, allowed transitions are those with a non-zero transition dipole moment between the initial and final states.
Mathematically, the molecular dipole moment can be expanded around its equilibrium geometry . Here we will use the displacement from equilibrium geometry for convenience,
the transition dipole matrix element between vibrational states and becomes:
Each term corresponds to an expectation value of powers of . We can interpret these terms as follows:
First term: for because the vibrational wavefunctions are orthogonal.
Second term: The term involving can be nonzero only if the dipole moment changes with internuclear distance, i.e., .
Higher-order terms: Usually small, but can contribute to overtones () when is strongly anharmonic.
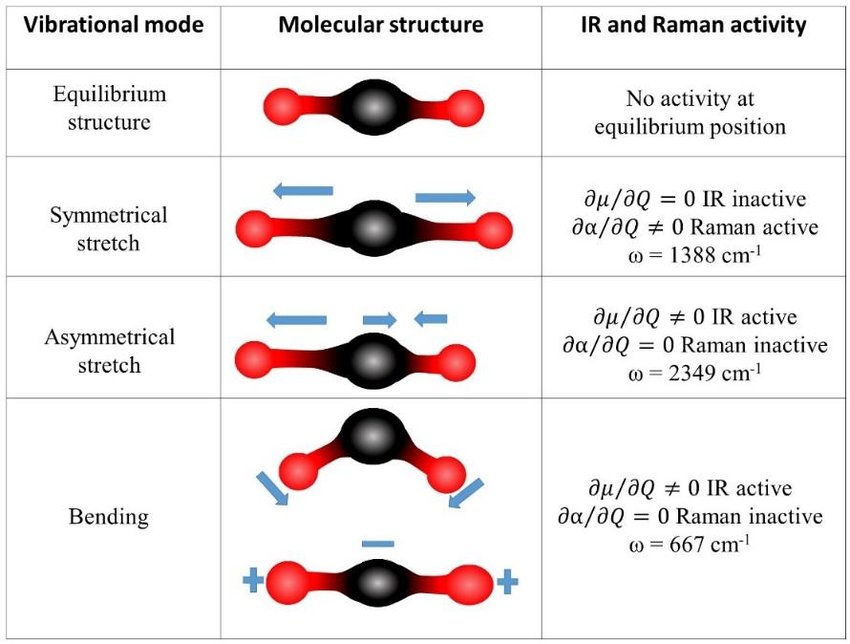
Figure 6:2D IR spectroscopy probing a protein by detecting amide vibrations in different parts of the molecule.
All homonuclear diatomic molecules (e.g., , , etc.) have zero dipole moment, which cannot change as a function of . Hence these molecules do not show vibrational spectra.
In general, all molecules that have a dipole moment have vibrational spectra, as a change in also results in a change of dipole moment. We still have the integral present in the second term.
For the harmonic oscillator approximation, this integral is zero unless . This provides an additional selection rule, which says that the vibrational quantum number may either decrease or increase by one.
IR spectra
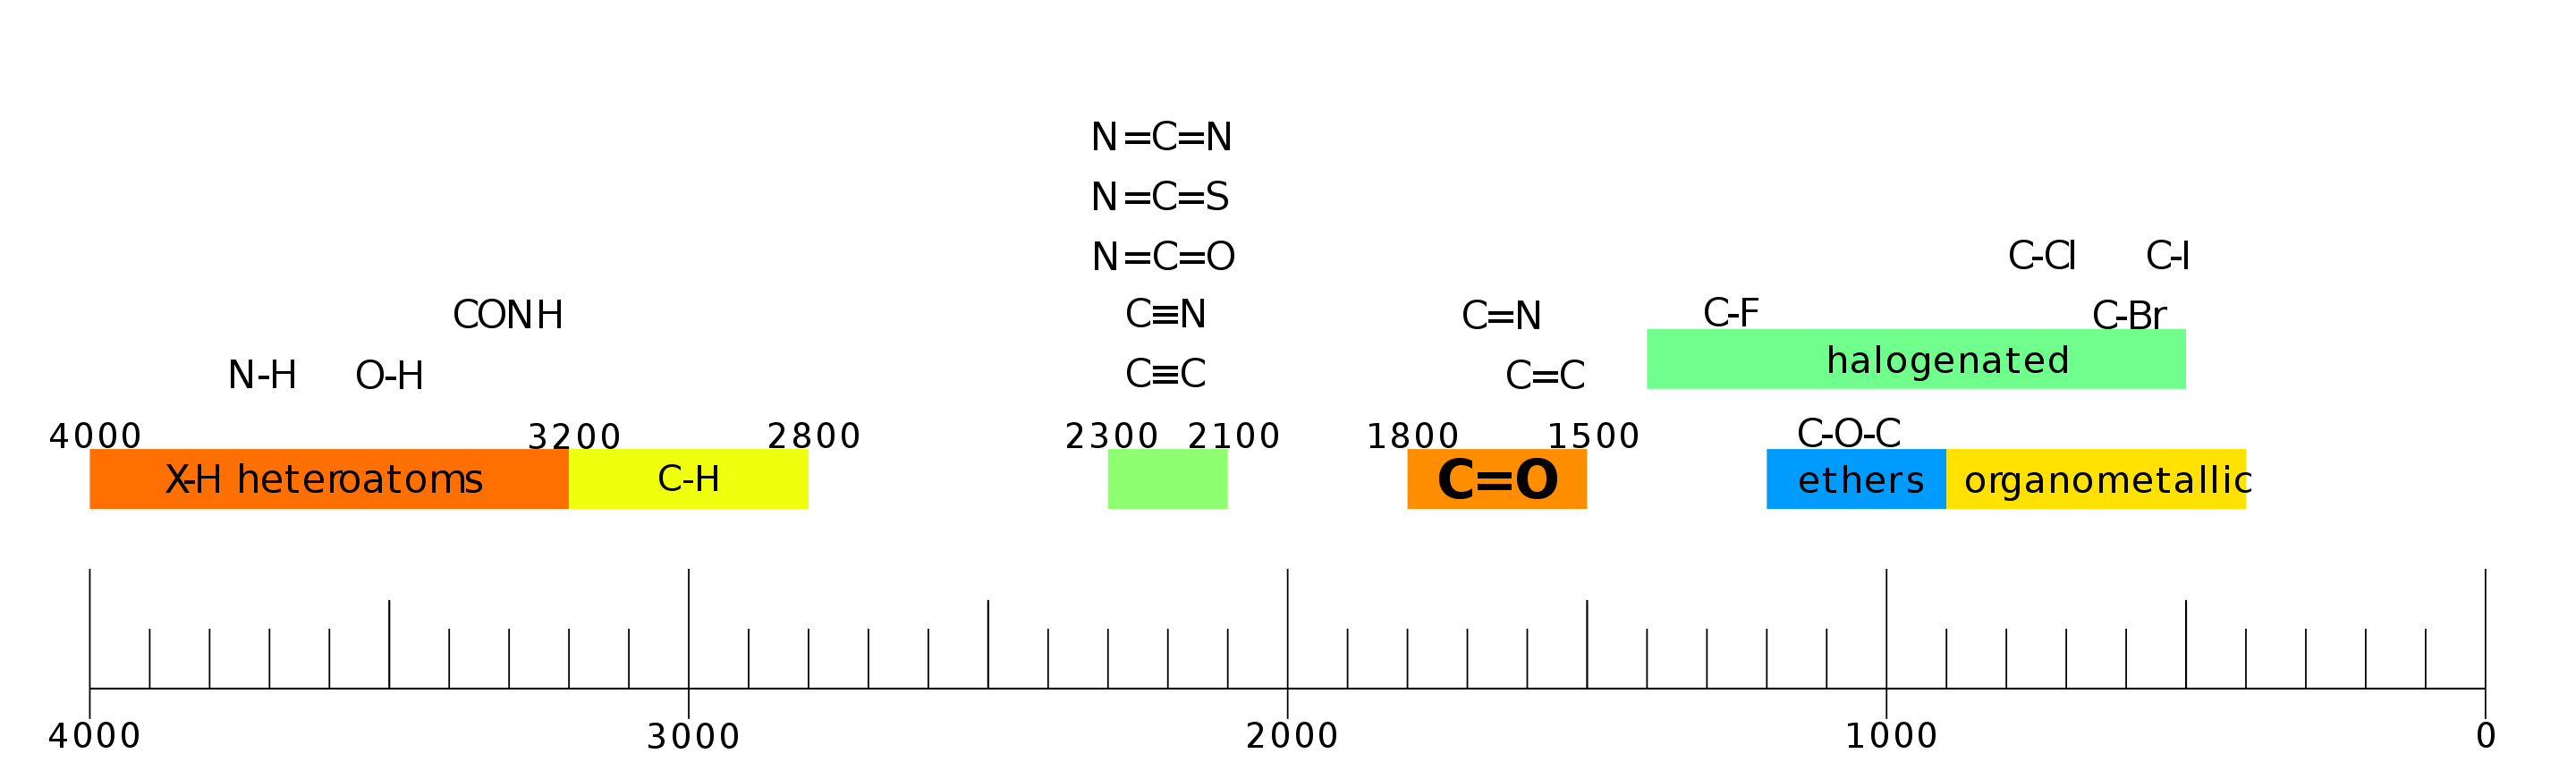
Figure 7:IR spectral frequencies arising from the vibrations of different bonds in organic molecules.
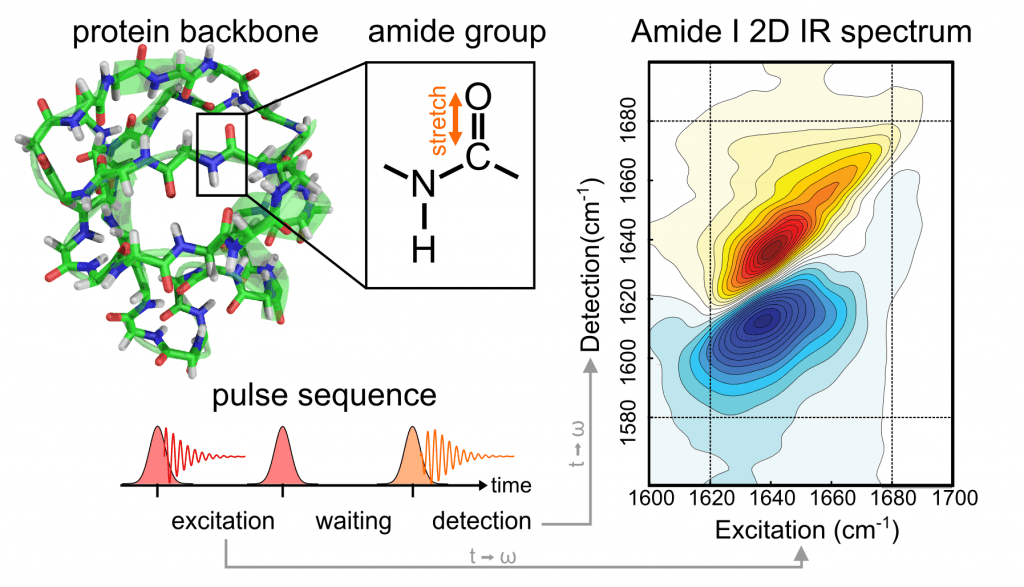
Figure 8:2D IR spectroscopy probing a protein by detecting amide vibrations in different parts of the molecule.