Animations#
%matplotlib inline

import numpy as np
import matplotlib.pyplot as plt
from matplotlib import animation
from matplotlib import rc

rc('animation', html='html5')
The animation class includes a function FuncAnimation that incorporations a user-specified function to update the figure for each frame of the animation. The result is an animation object which is subsequently called to actually produce the desired animation.
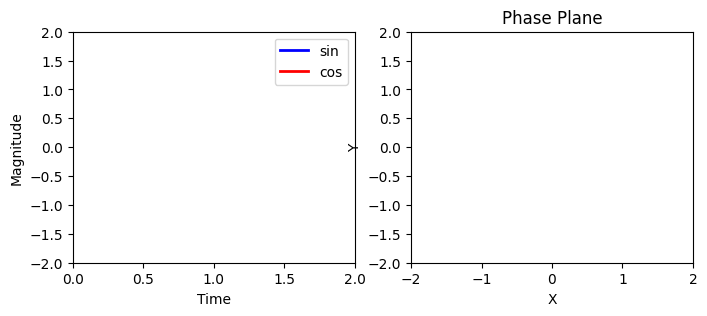
Step 1. Create the background frame.#
The following cell creates a background frame for the animation. These are standard matplotlib graphics commands, but where we have kept a reference to the resulting objects. The objects include fig for the figure object, ax1 and ax2 for each of the two plotting axes, and then txt_title, line1, line2, pt1, and line3 for graphical elements that will be updated in each frame of the animation.
# create a figure and axes
fig, (ax1, ax2) = plt.subplots(nrows=1, ncols=2, figsize=(8,3))

# set up the subplots as needed
ax1.set_xlim(( 0, 2))
ax1.set_ylim((-2, 2))
ax1.set_xlabel('Time')
ax1.set_ylabel('Magnitude')

ax2.set_xlim((-2,2))
ax2.set_ylim((-2,2))
ax2.set_xlabel('X')
ax2.set_ylabel('Y')
ax2.set_title('Phase Plane')

# create objects that will change in the animation. These are
# initially empty, and will be given new values for each frame in the animation.
#Note the commas! that is because ax.plot returns a list of 2D line objects
txt_title = ax1.set_title('')
line1, = ax1.plot([], [], 'b', lw=2)
line2, = ax1.plot([], [], 'r', lw=2)
pt1,   = ax2.plot([], [], 'g.', ms=20)
line3, = ax2.plot([], [], 'y', lw=2)

ax1.legend(['sin','cos']);
Step 2. Define a function to draw each frame#
The animiation function is a function you define to draw individual frames in the animation. The variable n will be the frame number. The function draws the frame by resetting the data values for the global objects txt_title, line1, line2, pt1, and line3 that were defined above.
# animation function. This is called sequentially
def drawframe(n):

    x = np.linspace(0, 2, 1000)
    y1 = np.sin(2 * np.pi * (x - 0.01 * n))
    y2 = np.cos(2 * np.pi * (x - 0.01 * n))
    line1.set_data(x, y1)
    line2.set_data(x, y2)
    line3.set_data(y1[0:50],y2[0:50])
    pt1.set_data(y1[0],y2[0])
    txt_title.set_text('Frame = {0:4d}'.format(n))

    return (line1,line2) #once line1 and line2 updated other global objects update too
Step 3. Create the Animation Object#
The animation class includes a function FuncAnimation that incorporations a user-specified function to update the figure for each frame of the animation. The result is an animation object which is subsequently called to actually produce the desired animation.
# blit=True re-draws only the parts that have changed.
anim = animation.FuncAnimation(fig,
                               drawframe,
                               frames=100,
                               interval=20,
                               blit=True)

anim
/var/folders/g4/3dkh7n1s0bjbl1tm3bgvvdsm0000gn/T/ipykernel_9309/841757530.py:10: MatplotlibDeprecationWarning: Setting data with a non sequence type is deprecated since 3.7 and will be remove two minor releases later
  pt1.set_data(y1[0],y2[0])
/var/folders/g4/3dkh7n1s0bjbl1tm3bgvvdsm0000gn/T/ipykernel_9309/841757530.py:10: MatplotlibDeprecationWarning: Setting data with a non sequence type is deprecated since 3.7 and will be remove two minor releases later
  pt1.set_data(y1[0],y2[0])
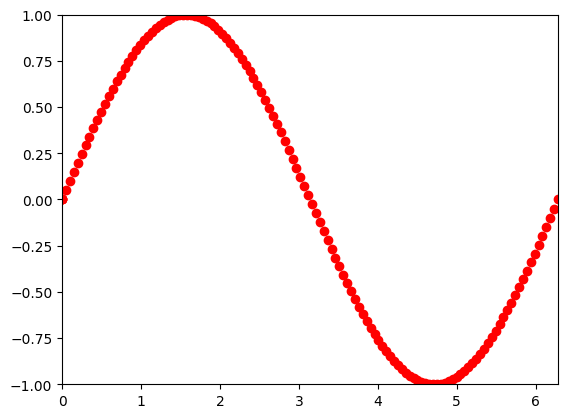
fig, ax = plt.subplots()
xdata, ydata = [], []

ln, = ax.plot([], [], 'ro')
ax.set_xlim(0, 2*np.pi)
ax.set_ylim(-1, 1);

def update(frame):

    xdata.append(frame)
    ydata.append(np.sin(frame))
    ln.set_data(xdata, ydata)

    return ln,

ani = animation.FuncAnimation(fig,
                              update,
                              frames=np.linspace(0, 2*np.pi, 128),
                              blit=True)
ani