
DEMO: Quantum Waves#
import numpy as np
import matplotlib.pyplot as plt
from ipywidgets.widgets import interact, interactive

%matplotlib inline
%config InlineBackend.figure_format = 'retina'
Linear superspositions and time dependence#
def psi_n(x, n):
    """Time-independent wavefunction for a particle in a box."""
    L = 1 # set box length

    return np.sqrt(2/L) * np.sin(n * np.pi * x / L)

def T_n(t, n):
    """Time dependence factor for the wavefunction."""
    L = 1 # set box length
    m, hbar = 1, 1 # set atomic units
    En = n**2 * np.pi**2 * hbar**2 / (2 * m * L**2)

    return np.exp(-1j * En * t / hbar)

def psi_combined(x, t, L, c1=1, c2=1, n1=1, n2=2):
    """Time-dependent wavefunction for a linear superposition of two states of PIB"""

    return c1 * psi_n(x, n1) * T_n(t, n1) + c2 * psi_n(x, n2) * T_n(t, n2)
Plot time dependent quantum wavefunctions#
def plot_wavefunction(t=0, c1=1, c2=1, n1=1, n2=1):
L = 1.0
x = np.linspace(0, L, 1000)
psi_squared_x = np.abs(psi_combined(x, t, c1, c2, n1, n2))**2
plt.plot(x, psi_squared_x )
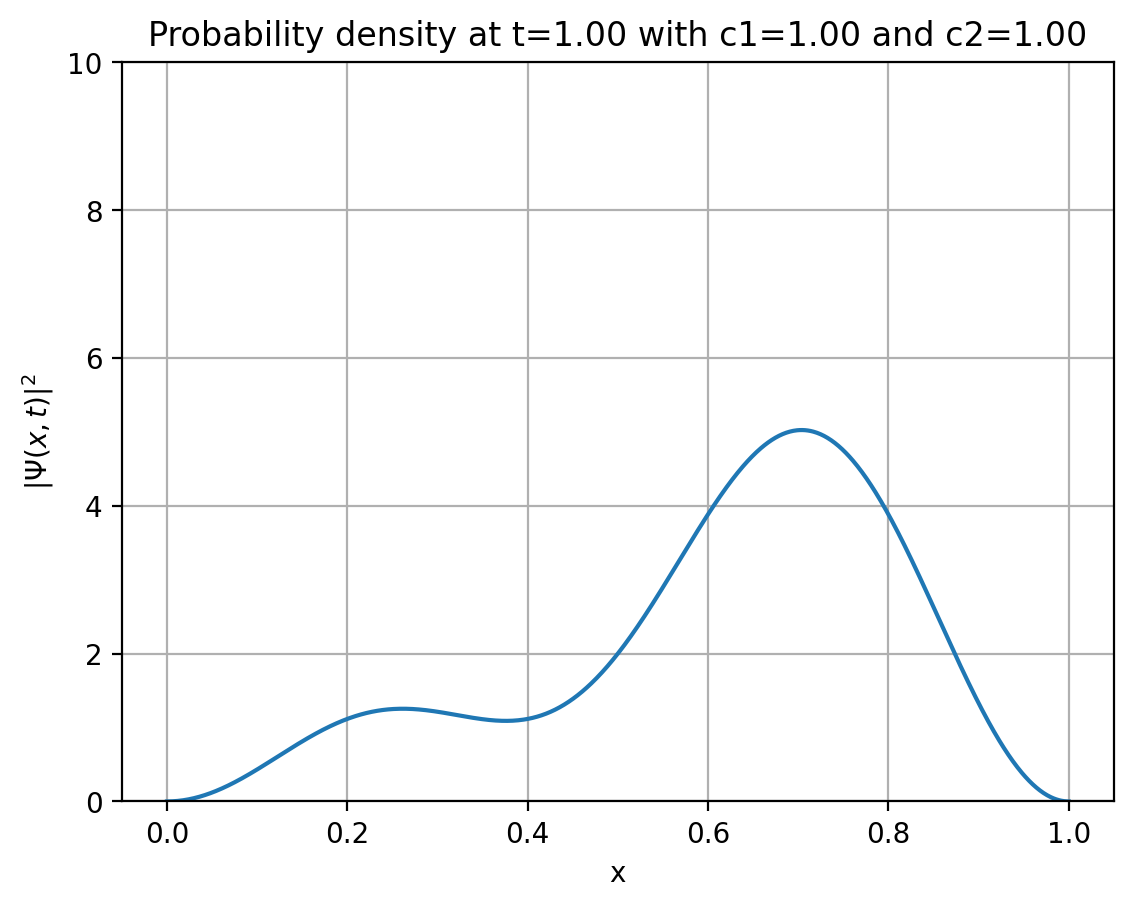
plt.title(f"Probability density at t={t:.2f} with c1={c1:.2f} and c2={c2:.2f}")
plt.xlabel('x')
plt.ylabel('$|\Psi(x, t)|^2$')
plt.grid(True)
plt.ylim([0, 10]) # Adjust the y limit to suit the range of the probability density
plt.show()
plot_wavefunction(t=1, c1=1, c2=1, n1=1, n2=1)
interact(plot_wavefunction, t=(0, 10, 0.1), c1=(-1.5, 1.5, 0.1), c2=(-1.5, 1.5, 0.1), n1=(1,5), n2=(1,5))
<function __main__.plot_wavefunction(t=0, c1=1, c2=1, n1=1, n2=1)>